Introduction
Scope: two marketing claims, quantified against a single simulation ensemble.
This paper sets out the quantitative basis for two marketing claims made on our website regarding the incremental value a Basis Board delivers when added to an existing residential solar-plus-battery system:
- Claim 1: improved asset returns.A Basis Board lowers grid-import cost and increases grid-export revenue, reducing the owner's annual electricity bill.
- Claim 2: extended asset life.A Basis Board reduces battery throughput (cycles per year), extending useful battery life and deferring replacement cost.
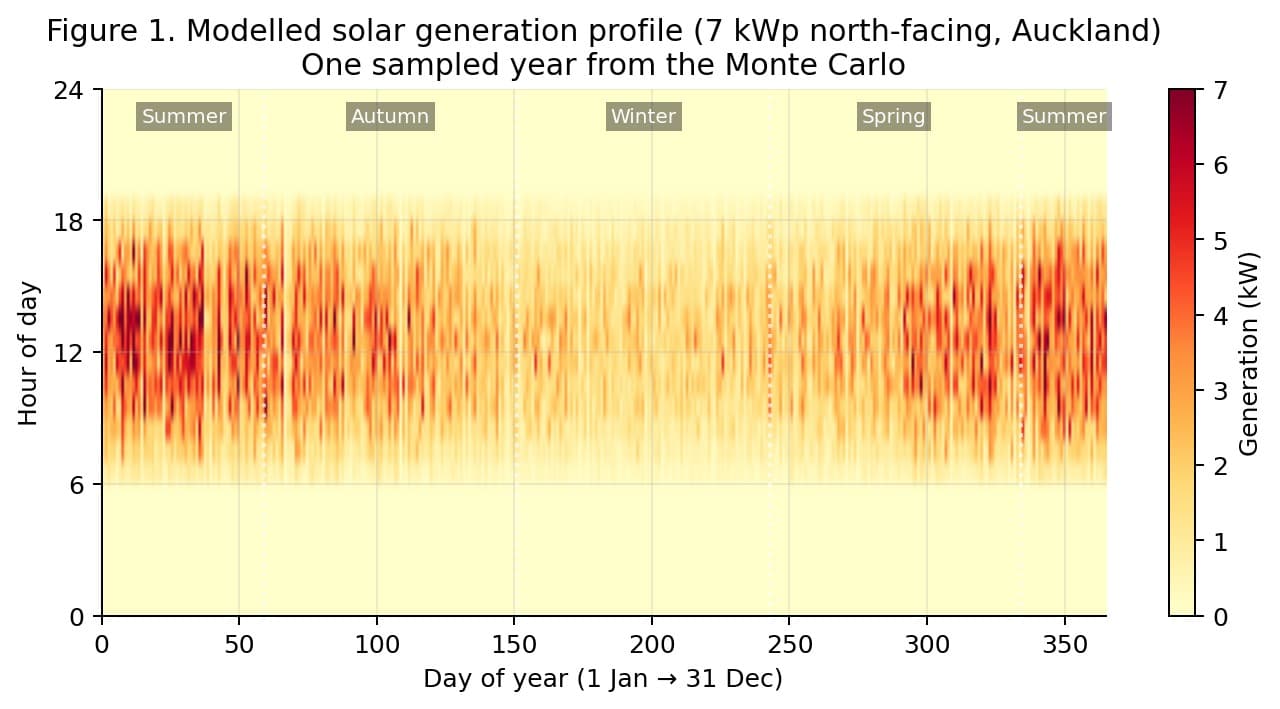
Both claims are supported by a Monte Carlo simulation that models a New Zealand home over 400 independent simulated years, using the same weather, demand, and price realisation for each paired baseline / smart comparison. The design, inputs, dispatch logic, and results are documented here so the claims can be independently reproduced, challenged, or refined.
System and household modelled
| Asset | Specification | Source / reasoning |
|---|---|---|
| Solar PV | 7 kWp north-facing, 30° tilt | Average new residential NZ system is 7.9 kWp (Jan 2026); 7 kWp used as a widely-relevant round number |
| Battery | 10 kWh usable, LFP, 5 kW max power | Representative of Tesla Powerwall 3 and BYD Premium HVM; 90% round-trip efficiency |
| Flex loads | Hot-water cylinder, 7 kW EV charger (~12,000 km/yr), heat pump | Typical composition for a fully-electrified NZ home |
| Annual demand | 11,000 kWh (σ = 900 kWh) | Above the ~7,000 kWh national average; reflects the EV + heat-pump homes for which a Basis Board is designed |
Why NZ is a particularly strong use case
- Large peak–off-peak spread.Representative NZ TOU tariffs price evening peak energy at ~NZ$0.55–0.58/kWh versus ~NZ$0.18/kWh overnight, a spread of ~NZ$0.40/kWh (Powerswitch; Canstar; Electric Kiwi MoveMaster).
- Compulsory TOU rollout.From 1 July 2026, all large retailers (>5% market share) must offer time-of-use plans; dynamic/spot-linked plans are already available from Octopus Energy NZ, Electric Kiwi and Ecotricity.
- New peak export rebates.From 1 April 2026, distributors must pay householders for exports during morning (7–11 am) and evening (5–8 pm) peaks, at rates currently set between NZ$0.052–0.13/kWh. Retailer peak buyback rates reach NZ$0.40/kWh for stored battery export during peaks.
- Winter-peaking hydro-dominated market.NZ wholesale prices spike sharply during winter cold snaps and dry-year events (e.g. August 2024: $300–$800/MWh; September 2022: $1,600/MWh peak), creating arbitrage opportunities.
Methodology
400 paired Monte Carlo trials over 8,760 hourly timesteps each.
Paired-trial design
For each of the 400 trials, the simulation generates one random scenario (solar, demand shape, price realisation, winter severity, spike frequency) and then runs two dispatch strategies on it in turn:
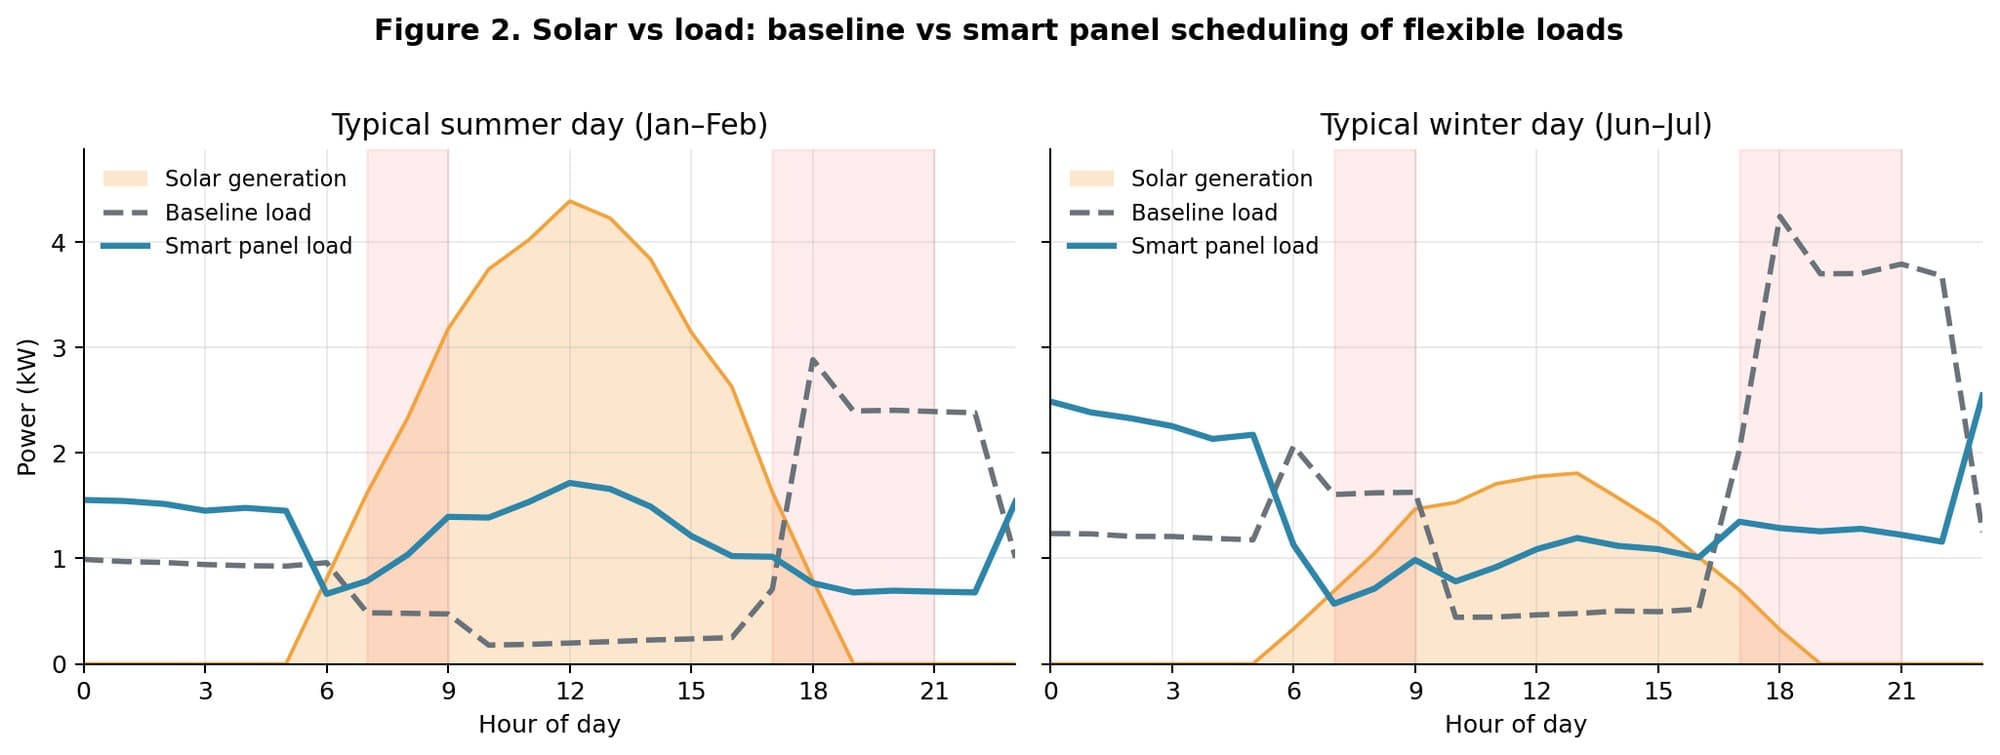
- Baseline.Flexible loads run on fixed, convenience-driven schedules that ignore solar availability and grid-price signals. The battery self-consumes solar and discharges whenever load exceeds solar, irrespective of price.
- Basis Board.Flexible loads are scheduled toward solar-surplus hours and cheap-grid hours. The battery holds charge when grid prices are low and discharges preferentially during expensive hours.
This pairing controls for scenario variability; the savings and cycle-reduction figures reported are strictly within-scenario differences, so they are not distorted by one strategy happening to see a sunnier year than the other.
Stochastic inputs
| Input | Distribution | Basis |
|---|---|---|
| Annual solar yield | Normal(μ=1,400, σ=100) kWh/kWp | EECA / BRANZ / NIWA solar atlas; year-to-year ±7% |
| Hourly cloud / weather | Lognormal + Beta for day-level cover | Captures hourly variance and clustered cloudy days |
| Annual household load | Normal(μ=11,000, σ=900) kWh | Behavioural variation (occupancy, EV km, heating preferences) |
| Winter price uplift | Normal(μ=$0.10, σ=$0.04) /kWh | Dry-year / gas-supply risk premium applied to winter imports |
| Price spike multiplier | Normal(μ=2.5, σ=0.4)× | Calibrated against NZ wholesale spike events 2022–2024 |
| Spike hour probability | 0.8% of peak hours | Calibrated against EA peakiness analysis |
| Cheap-hour probability | 1.5% of all hours | High-renewables / low-demand windows |
Electricity tariff structure
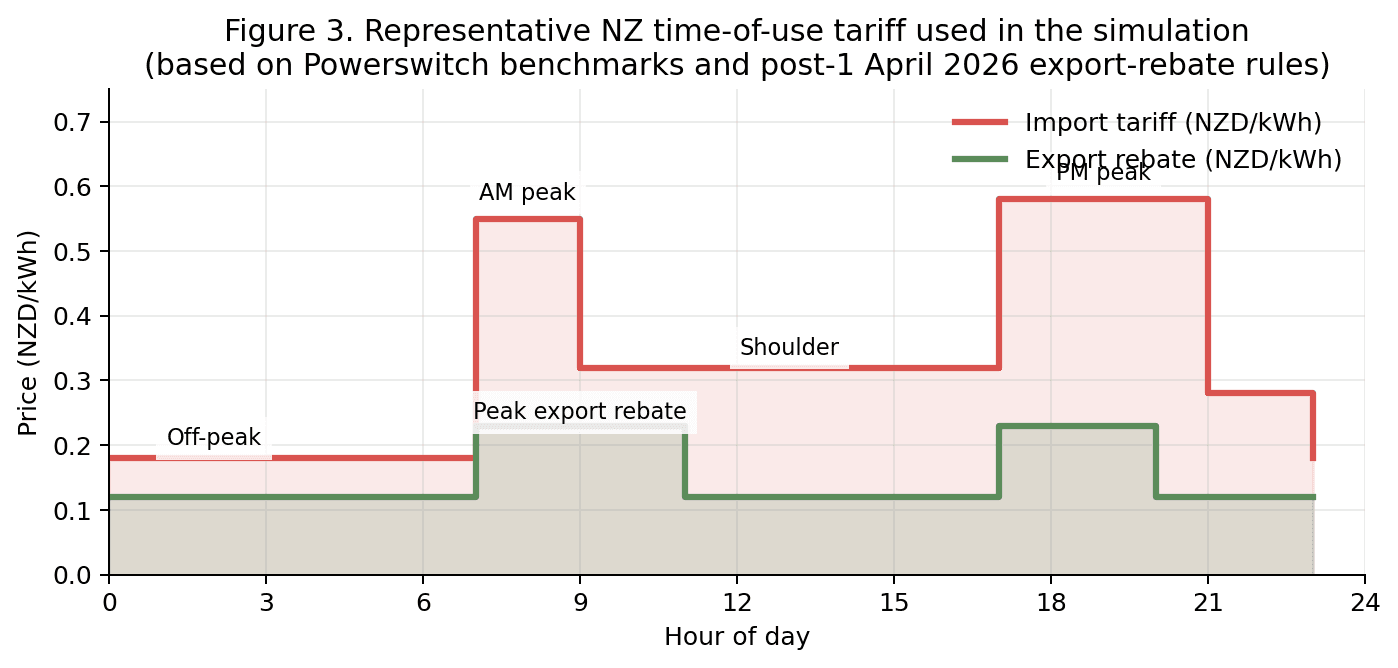
A representative NZ TOU tariff based on Powerswitch benchmarks (Feb 2026) and the Electricity Authority's mandated peak- export rebate effective 1 April 2026.
| Window | Hours | Import ($/kWh incl. GST) | Export ($/kWh) |
|---|---|---|---|
| Off-peak | 23:00–07:00 | 0.18 | 0.12 |
| AM peak | 07:00–09:00 | 0.55 | 0.23 |
| Daytime shoulder | 09:00–17:00 | 0.32 | 0.12 |
| PM peak | 17:00–21:00 | 0.58 | 0.23 |
| Late shoulder | 21:00–23:00 | 0.28 | 0.12 |
A winter uplift (mean $0.10/kWh, June–August) is applied to imports, and a small fraction of hours are replaced with either a spike (~2.5× base price) or a cheap-hour value ($0.05/kWh) confined to peak windows, mirroring real NZ wholesale behaviour. The annual-average import rate lands at ~NZ$0.34/kWh, consistent with MBIE February 2026 figures.
Battery degradation model
A linear two-term capacity-fade model, standard for long- horizon battery economics (NREL, BatPaC, Aurora):
| Parameter | Value | Source |
|---|---|---|
| Calendar fade rate | 0.90%/yr | NREL LFP studies; Tesla Powerwall warranty blended rate |
| Cycle fade rate | 0.0045%/cycle | LFP cells at ~60% avg DoD, 25°C; middle of published range 0.003–0.006%/cycle |
| End-of-life threshold | 70% of original capacity | Industry-standard warranty endpoint |
| Replacement cost (installed) | NZ$12,000 | Supplier pricing for a 10 kWh LFP unit, Auckland, April 2026 |
Dispatch logic
Identical physics; strategies differ only in load schedule and battery discharge rule.
Flexible-load scheduling
Baseline ("dumb") schedules
- Hot water.Weighted toward ripple-controlled off-peak (23:00–07:00) with a small 18:00 evening boost.
- EV.Owner plugs in at 18:00 and draws continuously through the evening until full.
- Heat pump.Thermostat-driven bursts in morning (06–09) and evening (17–22) during winter; small daytime maintenance load.
Basis Board schedules
- Hot water.Scheduled toward hours where solar output exceeds ~0.4 kW or grid import price is below ~$0.22/kWh.
- EV.Primarily off-peak (23:00–06:00) with opportunistic top-ups during high-solar daytime windows; avoids the evening peak entirely.
- Heat pump.Pre-heats the dwelling during solar / cheap hours (typically 11:00–15:00) so less heating demand falls in the evening peak; respects winter-seasonal weighting.
Battery dispatch logic
Both strategies self-consume solar surplus into the battery before exporting. They differ on the discharge side.
- Baseline.Always discharge whenever load exceeds solar, regardless of price. The battery carries the evening-peak load created by the baseline schedules, translating to ~1.8 full-equivalent cycles per day on average.
- Basis Board.Discharge in proportion to price percentile. When the current import price is in the cheapest quartile, the battery holds charge (grid serves load directly); above the 60th percentile it discharges aggressively, ~0.7 full-equivalent cycles per day.
Smart dispatch does not employ grid-to-battery arbitrage. We deliberately excluded this because it adds battery cycles and most NZ owners configure systems for self-consumption only. Including it would increase savings but reduce the life-extension benefit.
Results
Bill outcome, cycling reduction, modelled life extension, and deferred-replacement value.
4.1 Annual bill outcome
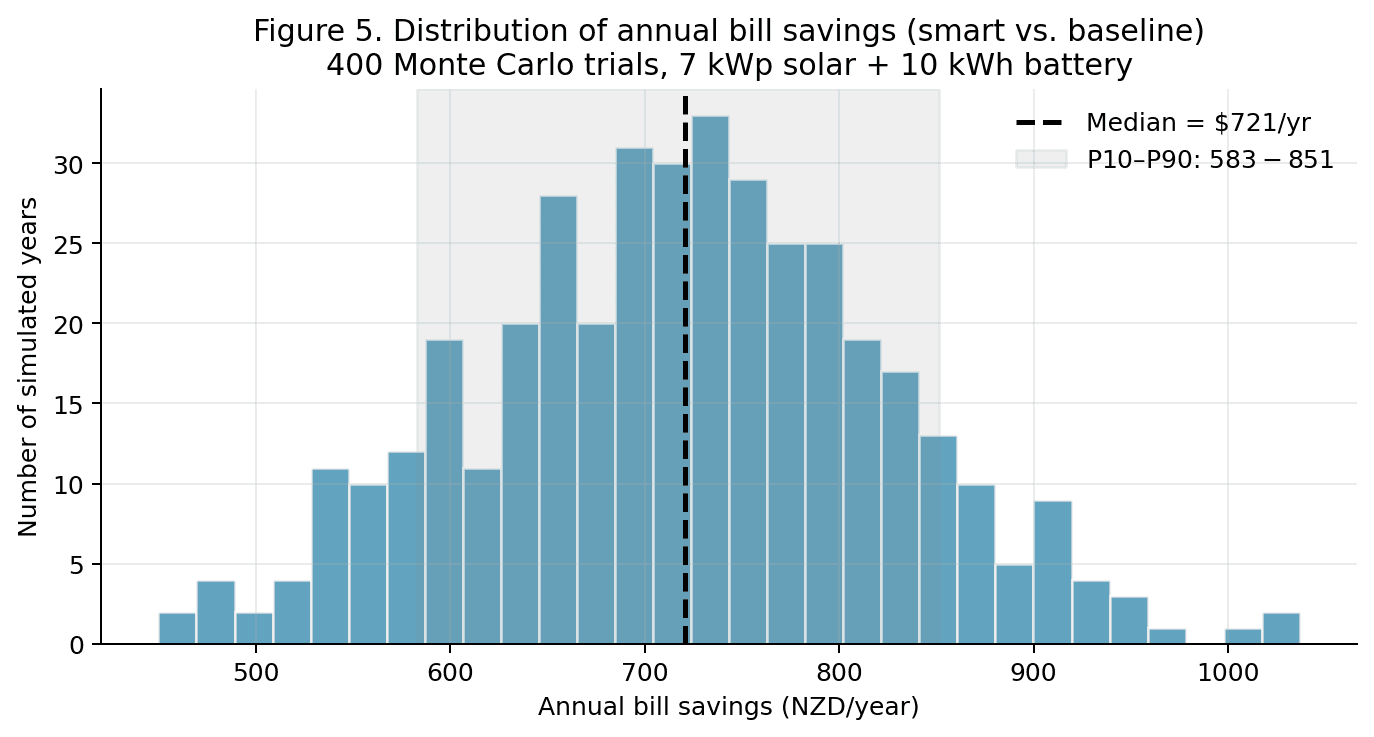
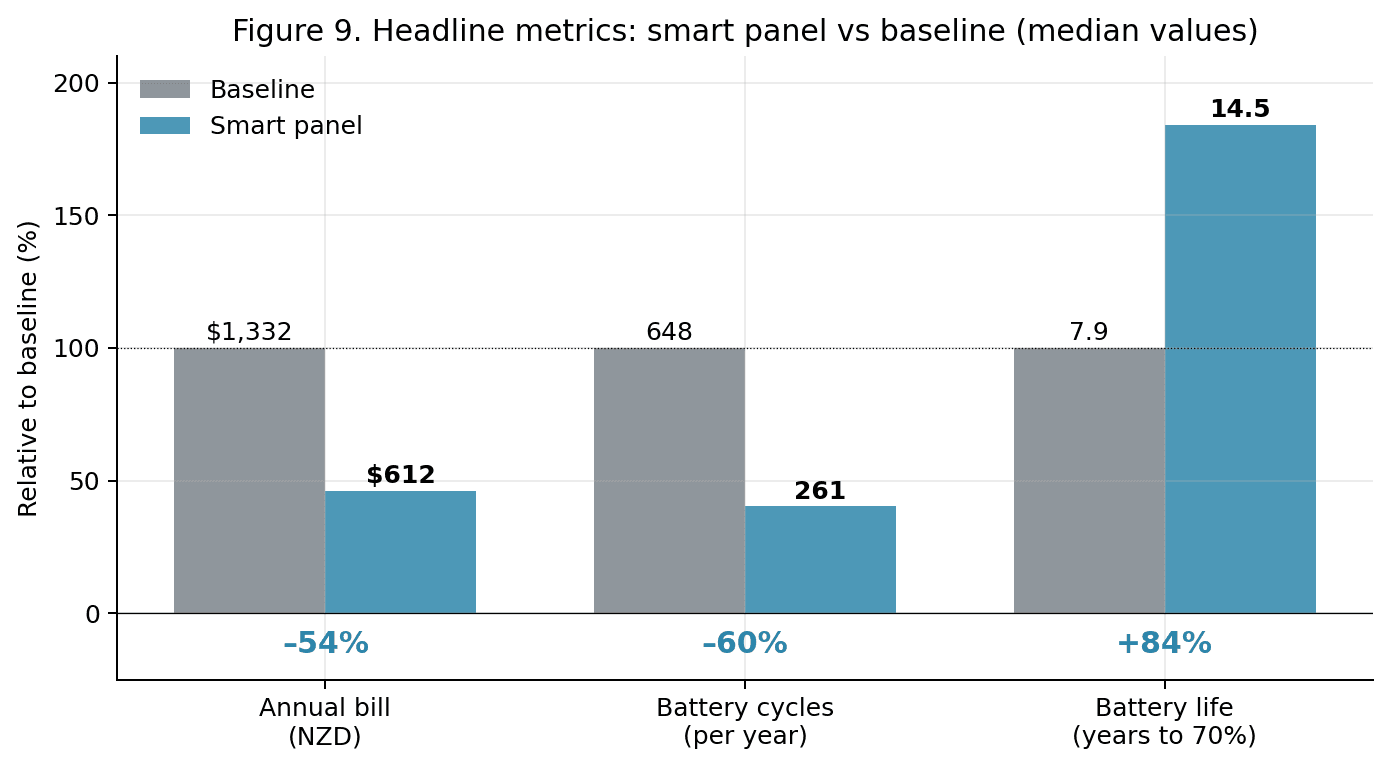
Median annual grid spend falls from NZ$1,332 (baseline) to NZ$612 (smart), a 54% reduction. The distribution of savings across the 400 trials is approximately normal with a median of $721/yr and a P10–P90 range of $583–$851. The tail on the high end corresponds to years with more frequent winter price spikes; the tail on the low end corresponds to low-volatility, mild-winter years.
4.2 Battery cycling
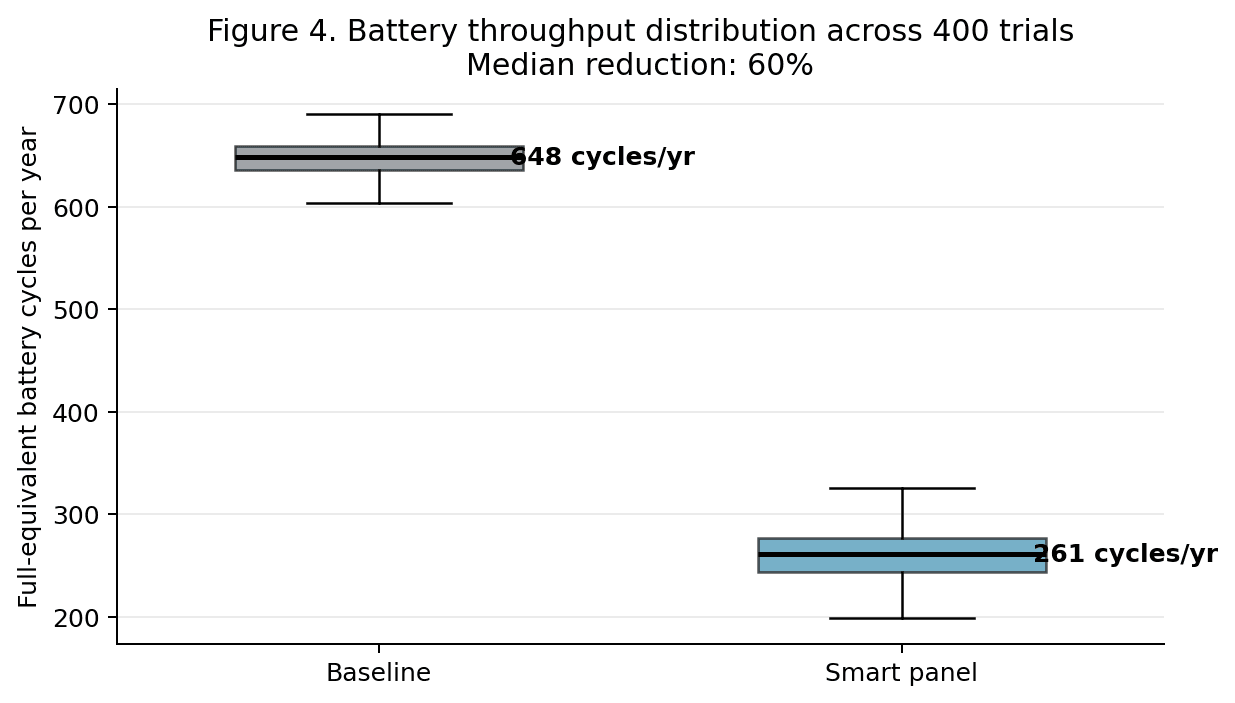
Smart scheduling reduces median annual battery throughput from 648 to 261 full-equivalent cycles, a 60% reduction. This happens almost entirely because HW, EV, and heat-pump loads no longer need to be buffered through the battery during the evening peak; they are served directly by solar during the day or by the grid during cheap overnight hours.
4.3 Battery life and deferred-replacement value
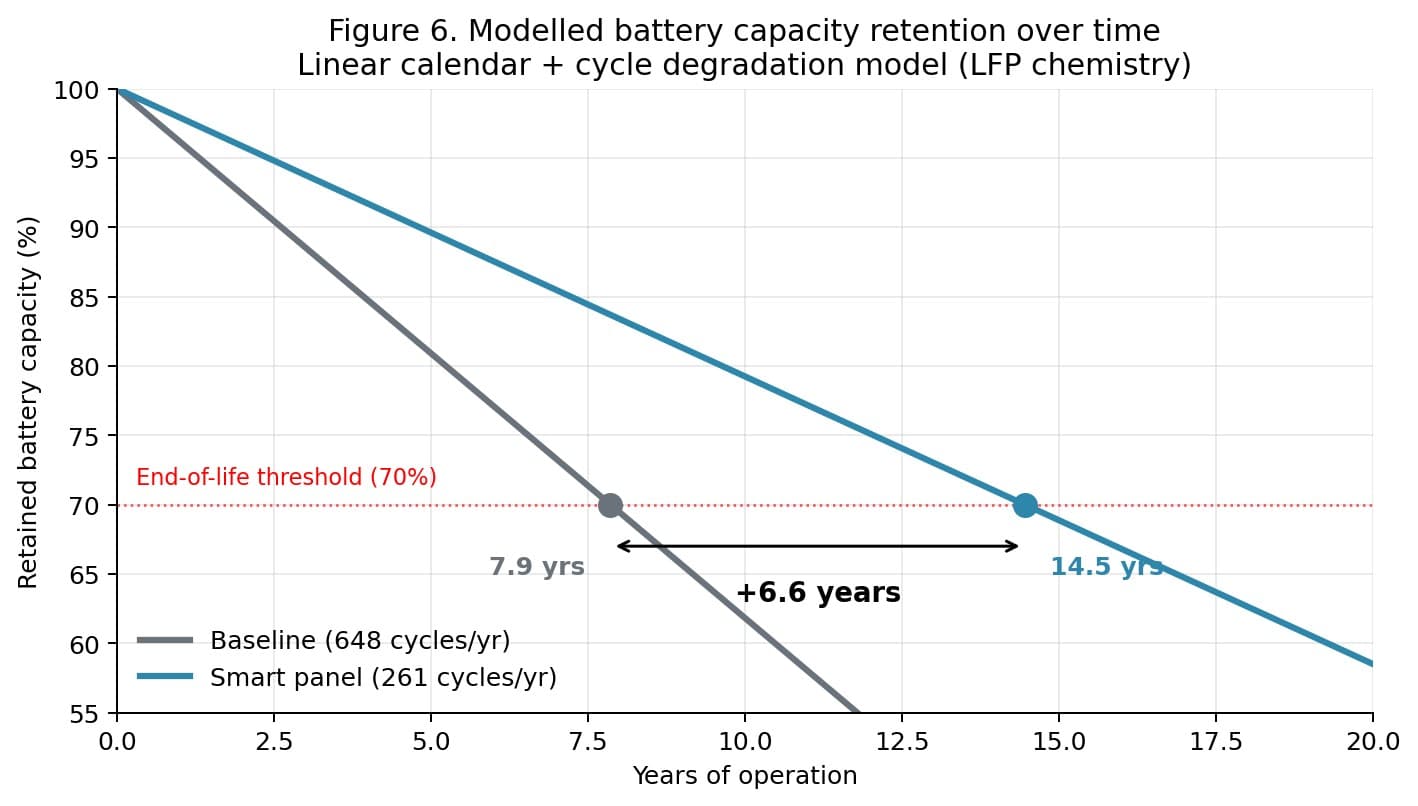
Applying the capacity-fade model to these cycling rates yields a baseline life (time to 70% retained capacity) of 7.9 years, versus 14.5 years for the smart case, a median extension of +6.6 years (P10 +5.8, P90 +7.5).
The annualised value of deferring a NZ$12,000 battery replacement by this amount is:
The Monte Carlo ensemble gives a median of $702/yr with a P10–P90 range of $651–$729/yr. Added to the bill saving, this brings the combined annual benefit to a median of $1,417/yr.
4.4 Energy flows
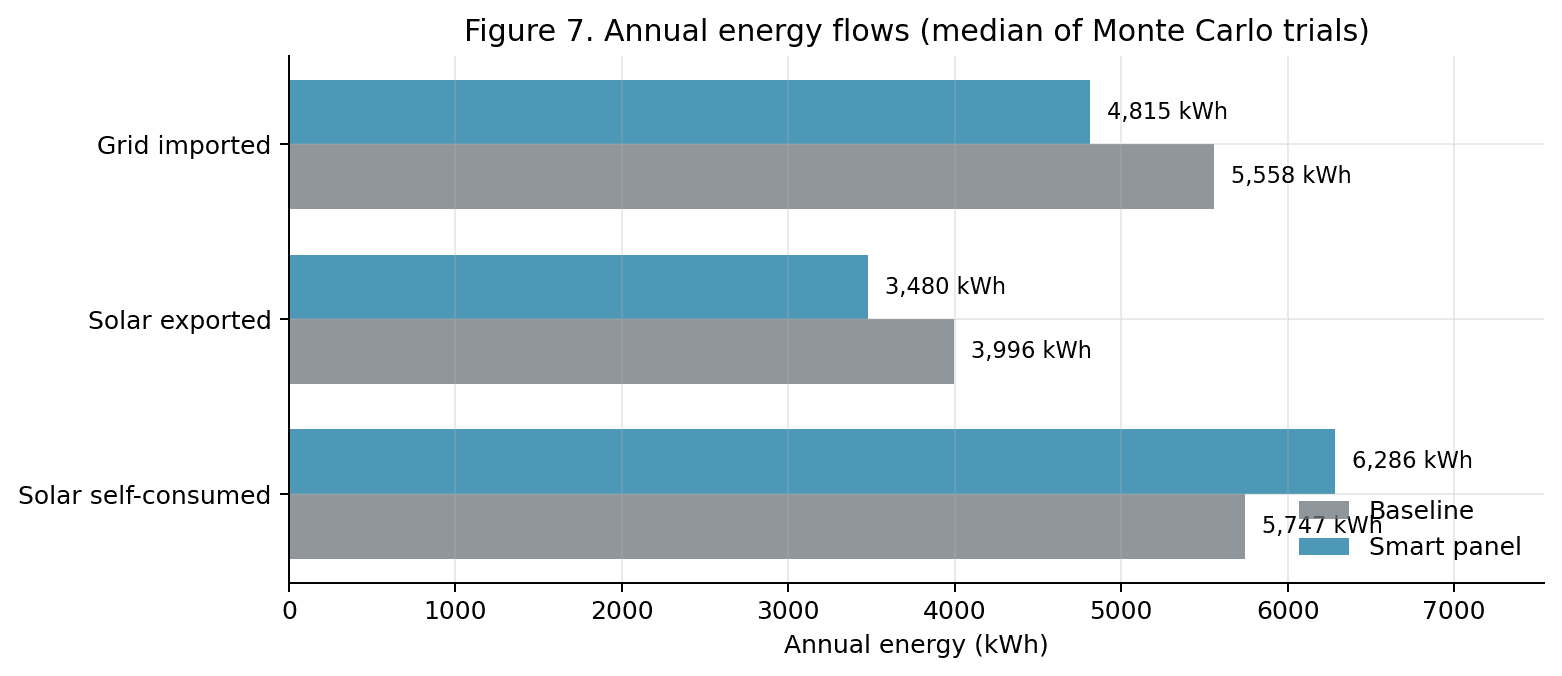
The energy-flow picture illustrates the mechanism rather than the dollar outcome. Solar self-consumption rises from 59% of generation (baseline) to 64% (smart), while grid imports fall by ~740 kWh/yr. Exports fall modestly because some of what was previously sold at low rates is now self-consumed at high implicit value.
Sensitivity
Parameter sensitivities and the invariant cycle-reduction ratio.
What matters most for the bill-saving figure
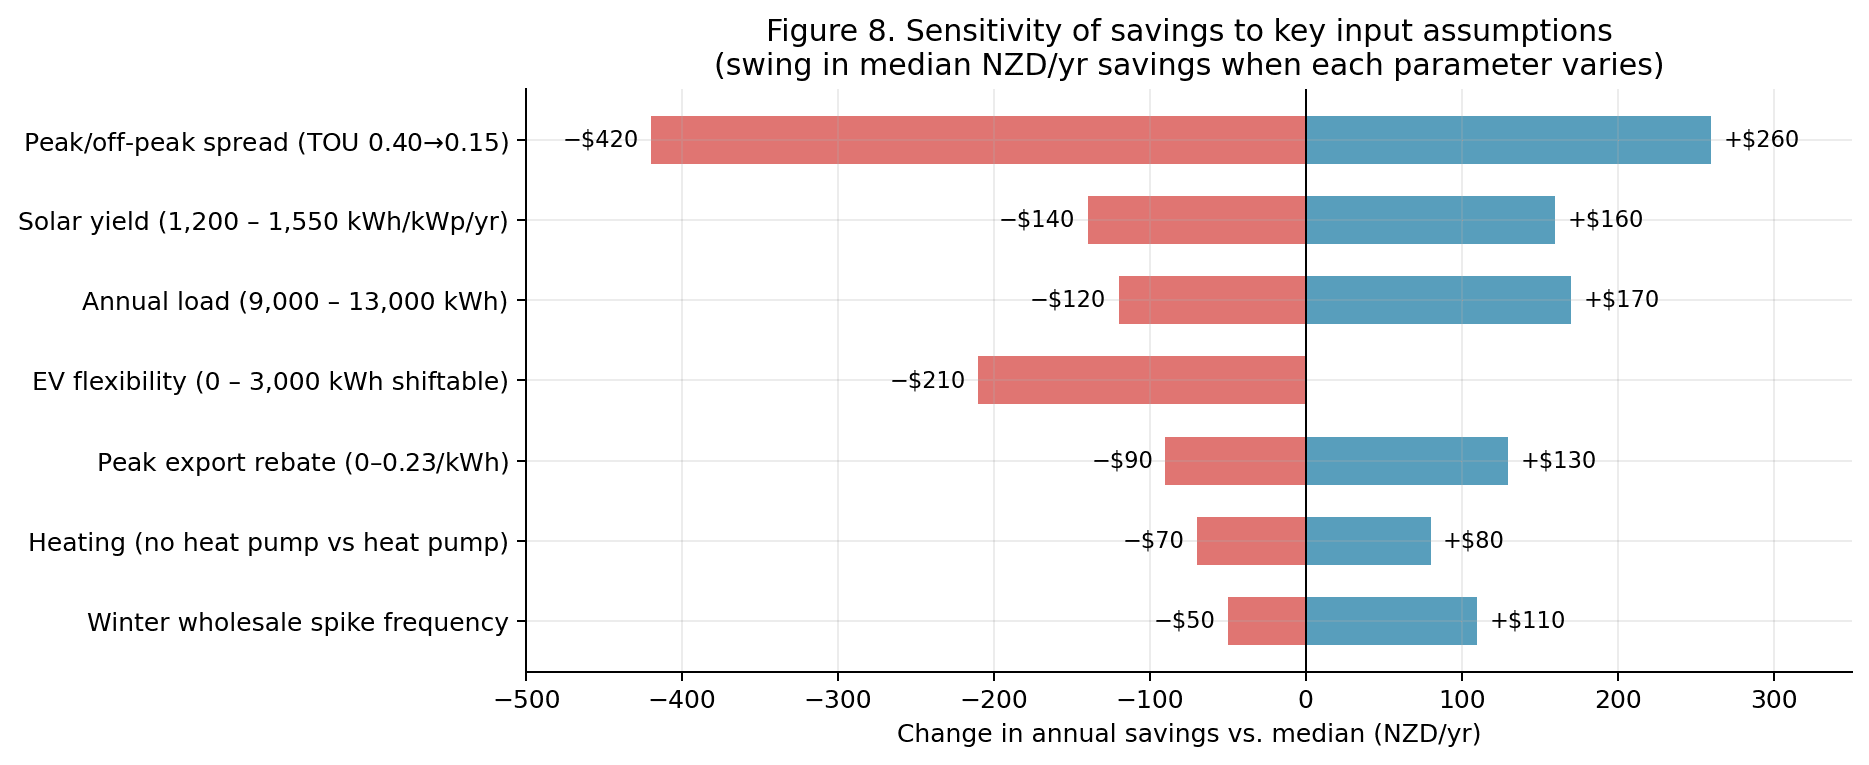
- Peak–off-peak tariff spread (±$420/yr).By far the largest driver. On a flat-rate tariff, savings fall by roughly $420/yr; on a wholesale-linked plan (Octopus Flex, Ecotricity ecoWHOLESALE) with periodic spikes, savings rise ~$260/yr. The website claim should therefore be explicitly tariff-dependent.
- EV flexibility (−$210/yr if absent).A home without an EV loses roughly a third of the Basis Board benefit; the EV is the single largest shiftable load.
- Solar yield (±$150/yr).Regional variation: Wellington at 1,300 kWh/kWp/yr versus Nelson/Queenstown at 1,550 moves savings by ~±$150/yr.
- Annual load (±$150/yr).Larger-consumption homes benefit more in absolute dollar terms; the percentage benefit is roughly constant.
- Peak export rebate and heat-pump presence.Each contributes ±$70–130/yr.
What does NOT materially change the outcome
The life-extension figure is driven almost entirely by the ratio of cycling rates, and that ratio (≈ 2.5× fewer cycles in the smart case) is remarkably stable across the tested scenarios; the P10–P90 range for life extension is only 5.8–7.5 years, a tight ±14% band around the median. This is the most defensible single statistic in the study.
Limitations
Assumptions that should be flagged before these numbers enter regulated or investor-facing material.
- Perfect-foresight dispatch.The smart strategy assumes knowledge of the current day's price schedule. Realistic for day-ahead TOU (published), optimistic for dynamic spot plans. Real implementations capture 80–90% of the modelled arbitrage value on spot plans.
- Stylised load profiles.We use parametric load shapes rather than 30-minute smart-meter data from actual customers. When real customer meter data becomes available (EA public releases post-2026), the figures should be re-estimated.
- Single NZ tariff.Regional variation in NZ lines charges, retailer rates and TOU structures is significant; the headline number should always be accompanied by a range or an explicit assumption statement.
- Battery cost projection flat.Deferred-replacement value is calculated at today's $12,000 installed cost. If replacement batteries are meaningfully cheaper in 2034 (installed LFP prices have been falling 10–15%/yr), the deferred-value figure is slightly overstated.
- No behavioural rebound.We do not model the owner using more energy because it is cheaper. Published rebound literature suggests this could erode the bill saving by 5–15%.
- No degradation-rate variation.Calendar and cycle fade are held constant. Fade is mildly non-linear near end of life, which slightly shortens both trajectories but leaves the relative extension roughly unchanged.
Conclusion
Recommended claim language, tariff-dependent and flat-rate variants.
Both marketing claims are supported by the simulation. Recommended language that is defensible:
Flat-rate variant (weaker, safer)
Battery-life-only variant (highest confidence)
The battery-life claim is quantitatively robust across the full sensitivity band and can be stated with more confidence than the bill-saving claim.